Grundlæggende statistik
| Institutionelle ejere | 151 total, 150 long only, 0 short only, 1 long/short - change of 0,00% MRQ |
| Gennemsnitlig porteføljeallokering | 0.1625 % - change of 108,34% MRQ |
| Institutionelle aktier (lange) | 64.321.757 (ex 13D/G) - change of 0,28MM shares 2,96% MRQ |
| Institutionel værdi (lang) | $ 586.497 USD ($1000) |
Institutionelt ejerskab og aktionærer
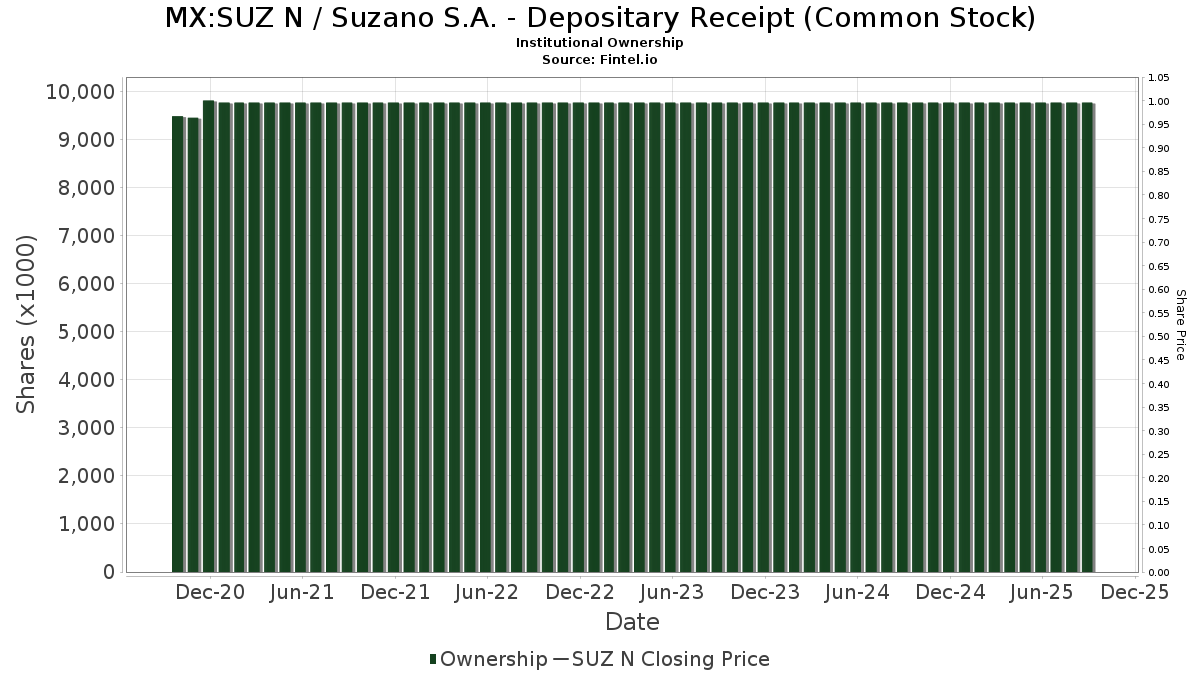
Suzano S.A. - Depositary Receipt (Common Stock) (MX:SUZ N) har 151 institutionelle ejere og aktionærer, der har indsendt 13D/G- eller 13F-formularer til Securities Exchange Commission (SEC). Disse institutioner har i alt 64,321,757 aktier. Største aktionærer omfatter Atlas FRM LLC, Deutsche Bank Ag\, State Street Corp, UBS Group AG, Goldman Sachs Group Inc, GNR - SPDR(R) S&P(R) Global Natural Resources ETF, Morgan Stanley, Jpmorgan Chase & Co, American Century Companies Inc, and Compass Rose Asset Management, LP .
Suzano S.A. - Depositary Receipt (Common Stock) (BMV:SUZ N) institutionel ejerskabsstruktur viser aktuelle positioner i virksomheden efter institutioner og fonde, samt seneste ændringer i positionsstørrelse. Større aktionærer kan omfatte individuelle investorer, investeringsforeninger, hedgefonde eller institutioner. Skema 13D angiver, at investoren besidder (eller besidder) mere end 5 % af virksomheden og har til hensigt (eller har til hensigt at) aktivt at forfølge en ændring i forretningsstrategi. Skema 13G indikerer en passiv investering på over 5%.
Fondens stemningsscore
Fund Sentiment Score (fka Ownership Accumulation Score) finder de aktier, der bliver mest købt af fonde. Det er resultatet af en sofistikeret, multi-faktor kvantitativ model, der identificerer virksomheder med de højeste niveauer af institutionel akkumulering. Scoringsmodellen bruger en kombination af den samlede stigning i oplyste ejere, ændringerne i porteføljeallokeringer i disse ejere og andre målinger. Tallet går fra 0 til 100, hvor højere tal indikerer et højere niveau af akkumulering for sine jævnaldrende, og 50 er gennemsnittet.
Opdateringsfrekvens: Dagligt
Se Ownership Explorer, som giver en liste over højest rangerende virksomheder.
AI+ Ask Fintel’s AI assistant about Suzano S.A. - Depositary Receipt (Common Stock).
Select a question to share a public post with an AI-crafted answer.
Thinking of good questions…
13F og NPORT arkivering
Detaljer om 13F-arkivering er gratis. Detaljer om NP-ansøgninger kræver et premium-medlemskab. Grønne rækker angiver nye positioner. Røde rækker angiver lukkede positioner. Klik på linket ikon for at se den fulde transaktionshistorik.
Opgrader
for at låse premium-data op og eksportere til Excel ![]() .
.
| Fil dato | Kilde | Investor | Type | Gennemsnitlig pris (Øst) |
Aktier | Δ Aktier (%) |
Rapporteret Værdi ($1000) |
Δ Værdi (%) |
Port Alloc (%) |
|
|---|---|---|---|---|---|---|---|---|---|---|
| 2025-11-12 | 13F | Headlands Technologies LLC | 0 | -100,00 | 0 | -100,00 | ||||
| 2026-01-28 | 13F | Kapitalo Investimentos Ltda | 784.450 | 249,42 | 7.327 | 247,20 | ||||
| 2025-11-14 | 13F | Raymond James Financial Inc | 0 | -100,00 | 0 | -100,00 | ||||
| 2026-02-17 | 13F | Laird Norton Trust Company, Llc | 41.033 | 392 | ||||||
| 2026-01-16 | 13F | Standard Life Aberdeen plc | 113.099 | 1.056 | ||||||
| 2025-11-13 | 13F | Provida Pension Fund Administrator | 0 | -100,00 | 0 | -100,00 | ||||
| 2026-02-13 | 13F | Cullen Capital Management, LLC | 0 | -100,00 | 0 | |||||
| 2026-02-13 | 13F | Mariner, LLC | 37.097 | 80,87 | 346 | 80,21 | ||||
| 2025-11-14 | 13F | Schonfeld Strategic Advisors LLC | 0 | -100,00 | 0 | |||||
| 2026-02-02 | 13F | Cornerstone Planning Group LLC | 16 | -72,41 | 0 | |||||
| 2026-02-03 | 13F | Crossmark Global Holdings, Inc. | 34.935 | 0,11 | 326 | -0,61 | ||||
| 2026-02-13 | 13F | Flow Traders U.s. Llc | 11.851 | 0 | ||||||
| 2026-02-02 | 13F | Qrg Capital Management, Inc. | 0 | -100,00 | 0 | |||||
| 2026-02-17 | 13F | MIRAE ASSET GLOBAL ETFS HOLDINGS Ltd. | 15.059 | -7,17 | 141 | -7,89 | ||||
| 2025-09-25 | NP | DFAE - Dimensional Emerging Core Equity Market ETF | 107.500 | 22,58 | 997 | 28,19 | ||||
| 2026-02-13 | 13F | Atlas Capital Advisors Llc | 2.341 | 0,00 | 22 | -4,55 | ||||
| 2026-01-26 | 13F | Mirae Asset Global Investments Co., Ltd. | 36.429 | 3,38 | 340 | 2,72 | ||||
| 2026-02-17 | 13F | Citadel Advisors Llc | Put | 0 | -100,00 | 0 | ||||
| 2026-01-27 | 13F | Waterfront Wealth Inc. | 396.495 | 2,08 | 3.921 | 12,74 | ||||
| 2026-02-12 | 13F | Quadrant Capital Group Llc | 60.735 | -32,41 | 567 | -32,82 | ||||
| 2026-02-13 | 13F | Morgan Stanley | 1.955.831 | 3,94 | 18.267 | 3,28 | ||||
| 2026-02-06 | 13F | EverSource Wealth Advisors, LLC | 1.448 | -21,18 | 14 | -23,53 | ||||
| 2025-08-27 | 13F/A | Squarepoint Ops LLC | 0 | -100,00 | 0 | -100,00 | ||||
| 2026-02-12 | 13F | Campbell & CO Investment Adviser LLC | 29.871 | 37,00 | 279 | 36,27 | ||||
| 2026-01-23 | 13F | Ritholtz Wealth Management | 14.330 | -3,27 | 134 | -4,32 | ||||
| 2026-02-05 | 13F | Allworth Financial LP | 401 | -11,09 | 4 | -25,00 | ||||
| 2026-02-24 | 13F | Bell Investment Advisors, Inc | 0 | -100,00 | 0 | |||||
| 2026-02-17 | 13F | Balyasny Asset Management Llc | 729.969 | 51,72 | 6.818 | 50,75 | ||||
| 2025-11-07 | 13F | Sierra Ocean, Llc | 0 | -100,00 | 0 | |||||
| 2026-01-23 | 13F | Farther Finance Advisors, LLC | 2.274 | 377,73 | 21 | 425,00 | ||||
| 2026-02-17 | 13F | Brevan Howard Capital Management LP | 0 | -100,00 | 0 | |||||
| 2026-01-16 | 13F | Compagnie Lombard Odier SCmA | 9.555 | 0,00 | 89 | 0,00 | ||||
| 2026-02-17 | 13F | Qube Research & Technologies Ltd | 84.906 | -80,45 | 793 | -80,57 | ||||
| 2026-01-05 | 13F | GAMMA Investing LLC | 1.017 | 31,74 | 9 | 28,57 | ||||
| 2026-02-18 | 13F | Vident Advisory, LLC | 16.427 | 19,49 | 153 | 18,60 | ||||
| 2026-02-06 | 13F | Pnc Financial Services Group, Inc. | 8.676 | -37,81 | 81 | -38,17 | ||||
| 2026-02-17 | 13F | Citadel Advisors Llc | 18.676 | -61,95 | 174 | -62,26 | ||||
| 2025-09-25 | NP | DFEM - Dimensional Emerging Markets Core Equity 2 ETF | 28.500 | 17,28 | 264 | 22,79 | ||||
| 2025-09-26 | NP | UBPIX - Ultralatin America Profund Investor Class | 15.743 | 14,07 | 146 | 18,85 | ||||
| 2026-02-13 | 13F | Van Eck Associates Corp | 65.180 | 6,09 | 1 | |||||
| 2026-02-10 | 13F | Savant Capital, LLC | 33.162 | 310 | ||||||
| 2026-02-17 | 13F | XTX Topco Ltd | 87.857 | 55,69 | 821 | 54,72 | ||||
| 2026-01-23 | 13F | Robeco Institutional Asset Management B.V. | 0 | -100,00 | 0 | |||||
| 2026-02-06 | 13F | Global Retirement Partners, LLC | 0 | -100,00 | 0 | |||||
| 2026-02-11 | 13F | O'shaughnessy Asset Management, Llc | 84.177 | 100,20 | 786 | 98,99 | ||||
| 2026-01-23 | 13F | Assetmark, Inc | 644 | 501,87 | 6 | 500,00 | ||||
| 2025-09-23 | NP | SLANX - DWS Latin America Equity Fund Class A | 37.800 | 0,00 | 350 | 4,79 | ||||
| 2026-02-11 | 13F | Metis Global Partners, LLC | 354.829 | 12,98 | 3.314 | 12,26 | ||||
| 2025-11-14 | 13F | Binnacle Investments Inc | 47 | 0 | ||||||
| 2026-02-17 | 13F | Aqr Capital Management Llc | 28.730 | 63,10 | 268 | 62,42 | ||||
| 2025-09-24 | NP | SNTKX - Steward International Enhanced Index Fund Class A | 25.371 | 0,00 | 235 | 4,91 | ||||
| 2026-02-11 | 13F | Ramirez Asset Management, Inc. | 850.261 | 7.941 | ||||||
| 2026-02-13 | 13F | Barclays Plc | 10.650 | 0,00 | 99 | -1,00 | ||||
| 2026-02-17 | 13F | Royal Bank Of Canada | 99.444 | -81,47 | 929 | -81,59 | ||||
| 2025-09-25 | NP | DFEV - Dimensional Emerging Markets Value ETF | 0 | -100,00 | 0 | -100,00 | ||||
| 2026-02-12 | 13F | Geo Capital Gestora de Recursos Ltd | 199.511 | -16,53 | 2 | -50,00 | ||||
| 2026-02-13 | 13F | Verition Fund Management LLC | 0 | -100,00 | 0 | |||||
| 2025-08-28 | NP | GNR - SPDR(R) S&P(R) Global Natural Resources ETF | 3.816.202 | -1,49 | 35.910 | -0,22 | ||||
| 2026-01-23 | 13F | Rsm Us Wealth Management Llc | 12.176 | 2,22 | 114 | 1,80 | ||||
| 2026-02-17 | 13F | Russell Investments Group, Ltd. | 144.902 | 0,00 | 1.353 | -0,66 | ||||
| 2026-02-05 | 13F | May Hill Capital, LLC | 11.960 | 112 | ||||||
| 2026-01-16 | 13F | Ronald Blue Trust, Inc. | 2.347 | 559,27 | 22 | 600,00 | ||||
| 2025-11-13 | 13F | EntryPoint Capital, LLC | 0 | -100,00 | 0 | -100,00 | ||||
| 2025-11-14 | 13F | Hrt Financial Lp | 0 | -100,00 | 0 | |||||
| 2026-02-13 | 13F | Wells Fargo & Company/mn | 0 | -100,00 | 0 | |||||
| 2026-02-14 | 13F | Rockefeller Capital Management L.P. | 20 | 0,00 | 0 | |||||
| 2025-11-14 | 13F | Sofos Investments, Inc. | 0 | -100,00 | 0 | |||||
| 2026-01-26 | 13F | Grace & White Inc /ny | 79.774 | 0,00 | 745 | -0,53 | ||||
| 2026-01-29 | 13F | Nbc Securities, Inc. | 101 | 17,44 | 1 | |||||
| 2026-02-11 | 13F | Syon Capital Llc | 11.158 | 104 | ||||||
| 2025-08-27 | NP | RYWTX - Emerging Markets 2x Strategy Fund Class A | 3.698 | 153,46 | 35 | 161,54 | ||||
| 2026-02-11 | 13F | Deutsche Bank Ag\ | 7.353.089 | 4.452,83 | 68.678 | 4.424,18 | ||||
| 2026-02-17 | 13F | Bank Of America Corp /de/ | 1.375.324 | -17,58 | 12.846 | -18,11 | ||||
| 2026-02-17 | 13F | Optiver Holding B.V. | 361.936 | 239,89 | 3.380 | 238,00 | ||||
| 2025-08-28 | NP | Principal Diversified Select Real Asset Fund | 9.093 | -1,02 | 86 | 0,00 | ||||
| 2025-11-14 | 13F | PineBridge Investments, L.P. | 0 | -100,00 | 0 | -100,00 | ||||
| 2026-01-12 | 13F | Arkfeld Wealth Strategies, L.L.C. | 29.693 | -0,69 | 276 | -2,82 | ||||
| 2026-02-17 | 13F | Guggenheim Capital Llc | 19.680 | -14,11 | 184 | -14,88 | ||||
| 2025-08-28 | NP | QEMM - SPDR MSCI Emerging Markets StrategicFactors ETF | 1.055 | -3,92 | 10 | -10,00 | ||||
| 2026-02-17 | 13F | Bizma Investimentos Ltda | 344.547 | 0,00 | 3.218 | -0,62 | ||||
| 2026-01-09 | 13F | SG Americas Securities, LLC | 529.300 | 5 | ||||||
| 2026-02-10 | 13F | Goldman Sachs Group Inc | 4.474.671 | 30,20 | 41.793 | 29,37 | ||||
| 2026-02-17 | 13F | Millennium Management Llc | 776.173 | 144,09 | 7.249 | 142,52 | ||||
| 2025-09-25 | NP | DEXC - Dimensional Emerging Markets ex China Core Equity ETF | 19.300 | 18,40 | 179 | 23,61 | ||||
| 2026-02-12 | 13F | Jane Street Group, Llc | Put | 0 | -100,00 | 0 | -100,00 | |||
| 2026-01-12 | 13F | Moody National Bank Trust Division | 33.666 | 14,86 | 314 | 14,18 | ||||
| 2026-02-17 | 13F | Engineers Gate Manager LP | 65.525 | 612 | ||||||
| 2026-02-09 | 13F | Harbour Investments, Inc. | 49 | 0,00 | 0 | |||||
| 2026-02-10 | 13F | Envestnet Asset Management Inc | 59.856 | 1,98 | 559 | 1,45 | ||||
| 2026-02-12 | 13F | CIBC Private Wealth Group, LLC | 2.000 | 0,00 | 19 | 0,00 | ||||
| 2026-02-17 | 13F | Fmr Llc | 2.934 | -8,23 | 27 | -10,00 | ||||
| 2025-11-12 | 13F | Erste Asset Management GmbH | 0 | -100,00 | 0 | -100,00 | ||||
| 2026-01-09 | 13F | Seafarer Capital Partners, LLC | 265.000 | 2.475 | ||||||
| 2026-02-17 | 13F | Grantham, Mayo, Van Otterloo & Co. LLC | 165.423 | 1.545 | ||||||
| 2025-11-12 | 13F | Principal Securities, Inc. | 0 | -100,00 | 0 | |||||
| 2026-02-12 | 13F | Wealthspire Advisors, LLC | 0 | -100,00 | 0 | |||||
| 2026-02-02 | 13F | Principal Financial Group Inc | 490.488 | 32,04 | 4.581 | 31,22 | ||||
| 2025-08-26 | NP | Profunds - Profund Vp Emerging Markets | 11.863 | 13,67 | 112 | 15,63 | ||||
| 2026-02-13 | 13F | Caitong International Asset Management Co., Ltd | 4.293 | 11.502,70 | 40 | |||||
| 2026-02-13 | 13F | Ieq Capital, Llc | 14.194 | -20,55 | 133 | -20,96 | ||||
| 2026-02-13 | 13F | JustInvest LLC | 21.637 | 4,47 | 202 | 4,12 | ||||
| 2025-09-25 | NP | DFCEX - Emerging Markets Core Equity Portfolio - Institutional Class This fund is a listed as child fund of Dimensional Fund Advisors Lp and if that institution has disclosed ownership in this security, then these positions will not be double counted when calculating total shares and total value | 59.174 | 0,00 | 549 | 4,58 | ||||
| 2026-01-29 | 13F | Vanguard Group Inc | 42.045 | -22,04 | 393 | -22,53 | ||||
| 2025-11-14 | 13F | Wetherby Asset Management Inc | 30.365 | -3,26 | 285 | -3,39 | ||||
| 2026-02-12 | 13F | Banco BTG Pactual S.A. | 15.191 | 142 | ||||||
| 2026-02-10 | 13F | Eurizon Capital SGR S.p.A. | 884 | 8 | ||||||
| 2025-09-25 | NP | DFSE - Dimensional Emerging Markets Sustainability Core 1 ETF | 12.572 | 0,00 | 117 | 4,50 | ||||
| 2025-11-14 | 13F | Jane Street Group, Llc | Call | 0 | -100,00 | 0 | -100,00 | |||
| 2026-02-09 | 13F | Fisher Asset Management, LLC | 131.680 | -14,90 | 1.230 | -15,47 | ||||
| 2026-01-14 | 13F | Jfs Wealth Advisors, Llc | 115 | 0,00 | 1 | 0,00 | ||||
| 2026-01-20 | 13F | Signaturefd, Llc | 5.180 | 11,49 | 48 | 11,63 | ||||
| 2026-02-13 | 13F | State Street Corp | 5.667.599 | 17,48 | 54.086 | 19,27 | ||||
| 2025-11-14 | 13F | Credit Agricole S A | 0 | -100,00 | 0 | |||||
| 2026-02-13 | 13F | Itau Unibanco Holding S.A. | 828.449 | 0,00 | 7.735 | -0,68 | ||||
| 2026-02-12 | 13F | Renaissance Technologies Llc | 504.100 | 12,60 | 4.708 | 11,88 | ||||
| 2026-02-13 | 13F | Bridgefront Capital, LLC | 0 | -100,00 | 0 | |||||
| 2026-02-17 | 13F | Tower Research Capital LLC (TRC) | 0 | -100,00 | 0 | |||||
| 2026-02-11 | 13F | Simplex Trading, Llc | 1.962 | -8,10 | 18 | |||||
| 2025-09-26 | NP | UUPIX - Ultraemerging Markets Profund Investor Class | 3.391 | 21,15 | 31 | 29,17 | ||||
| 2026-02-13 | 13F | MAI Capital Management | 99 | 0,00 | 1 | |||||
| 2026-02-12 | 13F | BlackRock, Inc. | 682.803 | -24,06 | 6.377 | -24,54 | ||||
| 2026-01-08 | 13F | True Wealth Design, LLC | 56 | -62,16 | 1 | -100,00 | ||||
| 2025-11-14 | 13F | Susquehanna International Group, Llp | Put | 0 | -100,00 | 0 | -100,00 | |||
| 2026-02-17 | 13F | EFG International AG | 250.000 | 2.335 | ||||||
| 2026-02-17 | 13F | Two Sigma Advisers, Lp | 67.000 | -91,31 | 626 | -91,37 | ||||
| 2026-02-11 | 13F | Compass Rose Asset Management, LP | 1.600.000 | 51,66 | 14.944 | 50,69 | ||||
| 2025-09-26 | NP | RTXAX - Tax-Managed Real Assets Fund Class A | 144.902 | 0,00 | 1.343 | 4,68 | ||||
| 2026-01-13 | 13F/A | Sanctuary Advisors, LLC | 72.499 | -44,83 | 681 | -44,90 | ||||
| 2026-02-17 | 13F | Susquehanna International Group, Llp | 14.839 | 139 | ||||||
| 2026-02-17 | 13F | Susquehanna International Group, Llp | Call | 10.200 | 95 | |||||
| 2025-09-26 | NP | Global Opportunities Portfolio - Global Opportunities Portfolio | 295.100 | 41,13 | 2.736 | 47,68 | ||||
| 2026-02-11 | 13F | Parallel Advisors, LLC | 5.438 | -41,78 | 51 | -42,53 | ||||
| 2026-02-13 | 13F | Citigroup Inc | 87.898 | -0,77 | 821 | -1,44 | ||||
| 2026-01-28 | 13F | DekaBank Deutsche Girozentrale | 778.866 | 0,00 | 10 | 28,57 | ||||
| 2026-02-13 | 13F | SPX Equities Gestao de Recursos Ltda | 115.964 | -19,59 | 1.083 | -20,07 | ||||
| 2026-02-17 | 13F | Ameriprise Financial Inc | 13.297 | 127 | ||||||
| 2026-02-06 | 13F | Profund Advisors Llc | 17.570 | -41,65 | 164 | -42,05 | ||||
| 2026-02-13 | 13F | Centiva Capital, LP | 15.268 | -24,77 | 143 | -25,26 | ||||
| 2026-01-12 | 13F | Abound Wealth Management | 15 | 0,00 | 0 | |||||
| 2026-02-05 | 13F | ANTIPODES PARTNERS Ltd | 196.114 | -1,01 | 1.832 | -1,66 | ||||
| 2026-02-17 | 13F | Advisor Group Holdings, Inc. | 101 | -31,76 | 1 | -100,00 | ||||
| 2026-02-12 | 13F | Dimensional Fund Advisors Lp | 357.462 | 14,53 | 3.339 | 13,81 | ||||
| 2026-01-26 | 13F | Cwm, Llc | 736 | -59,54 | 0 | |||||
| 2026-02-13 | 13F | Pathstone Holdings, LLC | 10.288 | 96 | ||||||
| 2026-01-23 | 13F | Lester Murray Antman dba SimplyRich | 21.725 | -0,14 | 0 | |||||
| 2026-02-13 | 13F | Marshall Wace, Llp | 75.279 | 703 | ||||||
| 2026-02-13 | 13F | VPR Management LLC | 33.605 | 0,00 | 314 | -0,63 | ||||
| 2026-01-30 | 13F | Us Bancorp \de\ | 6.107 | -92,99 | 57 | -93,04 | ||||
| 2025-10-14 | 13F | Yousif Capital Management, Llc | 0 | -100,00 | 0 | -100,00 | ||||
| 2026-02-13 | 13F | Parkside Financial Bank & Trust | 122 | 0,00 | 1 | 0,00 | ||||
| 2025-12-01 | 13F | Groupama Asset Managment | 30.210 | 0,00 | 284 | 1,07 | ||||
| 2025-09-25 | NP | DEHP - Dimensional Emerging Markets High Profitability ETF | 74.088 | 4,64 | 687 | 9,41 | ||||
| 2026-02-12 | 13F | Jane Street Group, Llc | 231.499 | 100,84 | 2.162 | 99,63 | ||||
| 2026-02-23 | 13F | Virtu Financial LLC | 16.231 | 61,76 | 0 | |||||
| 2026-02-13 | 13F | Hurley Capital, LLC | 145 | 1 | ||||||
| 2026-02-17 | 13F | Northern Trust Corp | 930.501 | -21,07 | 8.691 | -21,58 | ||||
| 2026-02-17 | 13F | Advisory Services Network, LLC | 0 | -100,00 | 0 | |||||
| 2026-02-10 | 13F | Bnp Paribas Arbitrage, Sa | 95.889 | -68,35 | 896 | -68,56 | ||||
| 2025-08-28 | NP | SPEM - SPDR(R) Portfolio Emerging Markets ETF | 412.101 | 6,67 | 3.878 | 8,02 | ||||
| 2026-02-11 | 13F | Group One Trading, L.p. | 7.646 | -50,03 | 71 | -50,35 | ||||
| 2026-02-19 | 13F | Atomi Financial Group, Inc. | 19.988 | 7,64 | 187 | 6,90 | ||||
| 2026-02-11 | 13F | Brandes Investment Partners, Lp | 239.957 | 14,78 | 2.241 | 14,05 | ||||
| 2026-02-17 | 13F | Voloridge Investment Management, Llc | 369.084 | 66,67 | 3.447 | 65,64 | ||||
| 2026-02-18 | 13F/A | Empowered Funds, LLC | 30.468 | 285 | ||||||
| 2026-02-17 | 13F | Trexquant Investment LP | 0 | -100,00 | 0 | |||||
| 2026-02-17 | 13F | Quantinno Capital Management LP | 99.383 | 38,10 | 928 | 37,28 | ||||
| 2026-01-27 | 13F | TD Waterhouse Canada Inc. | 221.814 | -3,87 | 2.072 | -4,30 | ||||
| 2026-02-11 | 13F | Jpmorgan Chase & Co | 1.879.587 | 323,72 | 17.555 | 321,08 | ||||
| 2026-01-29 | 13F | UBS Group AG | Put | 492.000 | 0,00 | 4.595 | -0,63 | |||
| 2025-11-13 | 13F | Brown Brothers Harriman & Co | 0 | -100,00 | 0 | -100,00 | ||||
| 2026-01-29 | 13F | UBS Group AG | Call | 492.000 | 0,00 | 4.595 | -0,63 | |||
| 2026-01-29 | 13F | UBS Group AG | 4.651.381 | -6,82 | 43.444 | -7,42 | ||||
| 2026-02-13 | 13F | American Century Companies Inc | 1.870.695 | 12,11 | 17.472 | 11,39 | ||||
| 2025-11-12 | 13F | Quantbot Technologies LP | 0 | -100,00 | 0 | -100,00 | ||||
| 2026-02-17 | 13F | Two Sigma Investments, Lp | 187.554 | -83,73 | 1.752 | -83,84 | ||||
| 2026-02-09 | 13F | Legal & General Group Plc | 55.121 | 0,00 | 515 | -0,39 | ||||
| 2026-02-13 | 13F | Ubs Asset Management Americas Inc | 910 | 8 | ||||||
| 2026-02-17 | 13F | DZ BANK AG Deutsche Zentral Genossenschafts Bank, Frankfurt am Main | 0 | -100,00 | 0 | |||||
| 2026-02-12 | 13F | Skopos Labs, Inc. | 54.719 | 158,93 | 507 | 158,16 | ||||
| 2026-02-13 | 13F | Rhumbline Advisers | 10.732 | -9,75 | 100 | -9,91 | ||||
| 2026-02-17 | 13F | Janus Henderson Group Plc | 0 | -100,00 | 0 | |||||
| 2025-11-14 | 13F | Graham Capital Management, L.P. | 0 | -100,00 | 0 | -100,00 | ||||
| 2026-02-03 | 13F | SBI Securities Co., Ltd. | 400 | 296,04 | 4 | |||||
| 2026-02-12 | 13F | Atlas FRM LLC | 17.320.000 | 0,00 | 161.769 | -0,64 | ||||
| 2026-02-10 | 13F | Channing Global Advisors, Llc | 0 | -100,00 | 0 | |||||
| 2026-02-17 | 13F | Creative Planning | 84.774 | 78,16 | 792 | 76,96 | ||||
| 2026-02-09 | 13F | Hantz Financial Services, Inc. | 41.107 | 28,16 | 0 | |||||
| 2026-01-22 | 13F | Massachusetts Financial Services Co /ma/ | 12.631 | 16,13 | 118 | 14,71 | ||||
| 2025-11-14 | 13F | Mml Investors Services, Llc | 0 | -100,00 | 0 | |||||
| 2025-09-25 | NP | DVRAX - MFS Global Alternative Strategy Fund A | 10.419 | 112,89 | 97 | 123,26 | ||||
| 2026-02-17 | 13F | Dynamo Internacional Gestao De Recursos Ltda. | 389.234 | 0,00 | 3.635 | -0,63 | ||||
| 2026-01-29 | 13F | Pictet Asset Management Holding SA | 83.311 | 167,77 | 778 | 166,44 | ||||
| 2026-02-13 | 13F | Toroso Investments, LLC | 63.396 | 6,39 | 592 | 5,71 |